
Crypto trading can feel overwhelming especially when charts are filled with lines, signals, and indicators.
👉 The truth? – You don’t need dozens of tools to trade effectively. You just need to understand a few powerful indicators that help you. However, before using indicators it’s also important to understand how to read crypto charts properly.
- Identify trends
- Find entry and exit points
- Make smarter decisions
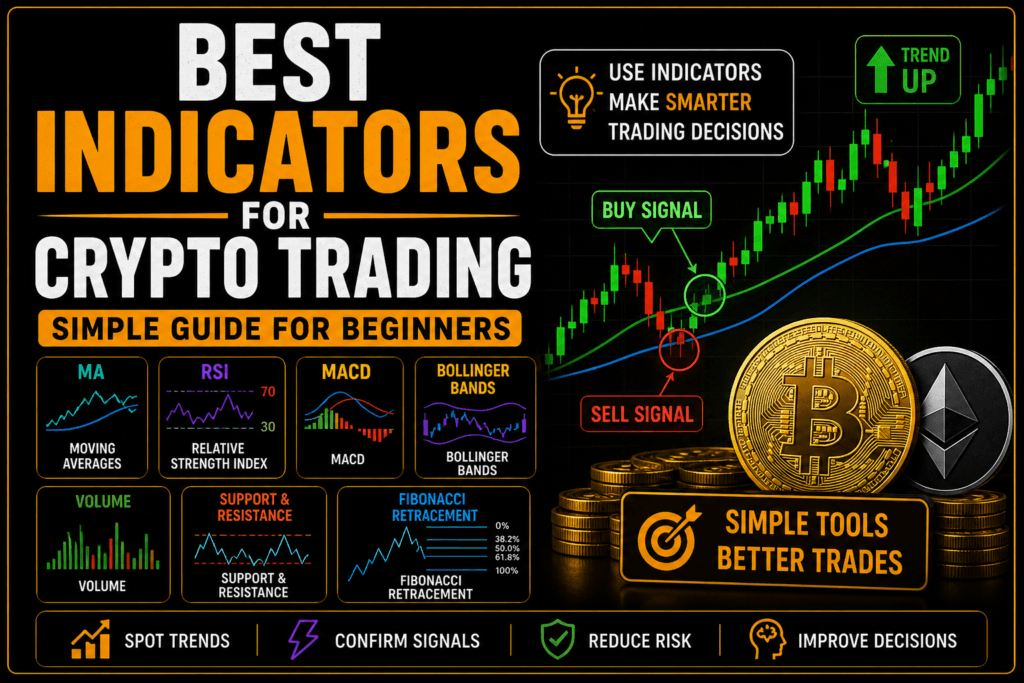
In this guide, you’ll learn the best indicators for crypto trading explained in a simple, beginner-friendly way.
📊 What Are Crypto Trading Indicators?
Crypto trading indicators are tools that analyze price data to help traders predict market movements. Many traders use platforms like TradingView to apply indicators and analyze charts effectively.
👉 They answer questions like:
- Is the price going up or down?
- Is the asset overbought or oversold?
- When should I enter or exit a trade?
These indicators are based on mathematical calculations using price, volume, and time.
🔍 Types of Indicators
Before we dive into the best ones, understand the three main types:
📈 1. Trend Indicators
👉 Show the overall market direction (uptrend or downtrend)
⚡ 2. Momentum Indicators
👉 Measure the strength of price movement
📊 3. Volume Indicators
👉 Show how much trading activity is happening
Indicators are tools that help traders make decisions, but they work best when combined with proper risk management strategies.
🏆 Best Indicators for Crypto Trading
📉 1. Moving Averages (MA)
👉 One of the most popular indicators.
- Shows the average price over time
- Helps identify trends
📌 Types:
- Simple Moving Average (SMA)
- Exponential Moving Average (EMA)
👉 When price is above MA → Uptrend
👉 When below → Downtrend
Moving averages are widely used in trend analysis and are essential for beginners learning technical analysis.
🔥 2. Relative Strength Index (RSI)
👉 A momentum indicator that shows:
- Overbought (above 70)
- Oversold (below 30)
👉 Helps you:
- Avoid buying at the top
- Spot potential reversals
RSI is especially useful to avoid emotional decisions driven by FOMO in crypto.
⚡ 3. MACD (Moving Average Convergence Divergence)
👉 A trend + momentum indicator.
- Shows relationship between two moving averages
- Generates buy/sell signals
📌 Signal:
- Line crossover = possible trend change
MACD signals should always be confirmed with other indicators and market context.
📦 4. Bollinger Bands
👉 Shows price volatility.
- Upper band = resistance
- Lower band = support
👉 Helps identify:
- Breakouts
- Overbought/oversold conditions
📊 5. Volume
👉 Confirms price movement and always check volume before entering a trade.
- High volume = strong move
- Low volume = weak move
Volume confirmation is crucial before entering a trade, especially during breakouts.
🧱 6. Support & Resistance
👉 Not a technical indicator but extremely important.
- Support = price floor
- Resistance = price ceiling
👉 Helps you:
- Plan entries
- Set targets
These levels are key when setting stop-loss and take-profit orders in crypto.
📐 7. Fibonacci Retracement
👉 Used to find potential reversal levels and helps traders buy during pullbacks.
📌 Common levels:
- 38.2%
- 50%
- 61.8%
🧠 How to Use Indicators Together
👉 Don’t overload your cryptocurrency chart but combining indicators with a clear strategy helps reduce confusion and improve decision-making.
Best approach:
✔ Use 2-3 indicators only
✔ Combine different types (trend + momentum)
Example:
- Moving Average + RSI
- MACD + Volume
👉 Simplicity = better decisions
⚠️ Common Mistakes to Avoid
❌ Using too many indicators
❌ Blindly following signals
❌ Ignoring market context
❌ Not using risk management
👉 Indicators guide you but they don’t guarantee profits. Many traders lose money not because of indicators, but due to poor risk management and emotional trading.
💡 Pro Tips for Beginners
✔ Start with simple indicators
✔ Practice on demo charts
✔ Focus on consistency
✔ Combine with strategy
👉 Smart trading is about discipline, not complexity.
📉 Why Indicators Alone Are Not Enough
Indicators are tools, not magic. You still need:
- A trading plan
- Risk management
- Emotional control
⚡ Quick Checklist
✔ Use 2-3 indicators max
✔ Confirm signals with volume
✔ Avoid emotional trading
✔ Follow a strategy
🧮 8. Strategy + Monetization Section 💰
Before placing trades:
- Compare crypto exchange fees
- Track performance using crypto ROI calculator
- Plan your entry and exit strategy
🚀 Final Thoughts
The best indicators for crypto trading are not the most complex ones. They are the ones you understand and use consistently.
Focus on:
- Simplicity
- Discipline
- Strategy
And over time, your trading decisions will improve.
Key Takeaways
- The best indicators for crypto trading include RSI, MACD, moving averages, and volume.
- Indicators help identify trends, momentum, and potential entry or exit points.
- Using 2–3 indicators together is more effective than overloading your chart.
- Volume confirmation is essential before acting on any trading signal.
- Indicators should be used along with strategy, risk management, and discipline.
Frequently Asked Questions (FAQ)
1. What are the best indicators for crypto trading?
The best indicators include moving averages, RSI, MACD, Bollinger Bands, and volume, as they help analyze trends and market momentum.
2. How many indicators should I use in crypto trading?
It is recommended to use 2–3 indicators to avoid confusion and make clearer trading decisions.
3. Is RSI good for crypto trading?
Yes, RSI is widely used to identify overbought and oversold conditions, helping traders avoid buying at the top.
4. Can I rely only on indicators for trading?
No, indicators should be combined with risk management, strategy, and market understanding for better results.
5. Which indicator is best for beginners?
Moving averages and RSI are considered the best indicators for beginners due to their simplicity and effectiveness.