We’ve all said it: “I missed the boat. I should have bought Bitcoin years ago“. It’s easy to look at a chart from 2011 and wish you had a time machine. But the truth is, very few people have the nerve to dump their life savings into an asset when it crashes by 50% in a week. That’s the time when Bitcoin DCA works.
Most successful investors don’t rely on luck or timing. They rely on Dollar Cost Averaging (DCA). But is DCA actually profitable? Or is it just something influencers say to keep you buying? Today, we’re going to use the Bitcoin ROI Calculator to find out exactly how much you’d have if you quietly invested just $100 a month starting in January 2020. Or you can visualize your future by choosing the wealth goal sector which can help you set your goal. It gives you the option to select one-time or DCA investment way of calculating.
The “Safe” Strategy: Buying the top and the bottom using Bitcoin DCA
Dollar Cost Averaging (DCA) is the strategy of buying a fixed dollar amount of an asset at regular intervals, regardless of the price.
- When Bitcoin is expensive ($69,000), your $100 buys a tiny slice.
- When Bitcoin crashes ($16,000), your $100 buys a huge chunk.
Over time, this lowers your “Average Cost Basis.” You don’t need to stress about checking charts every hour. You just buy, hold, and wait and enjoy the magic of Bitcoin DCA.
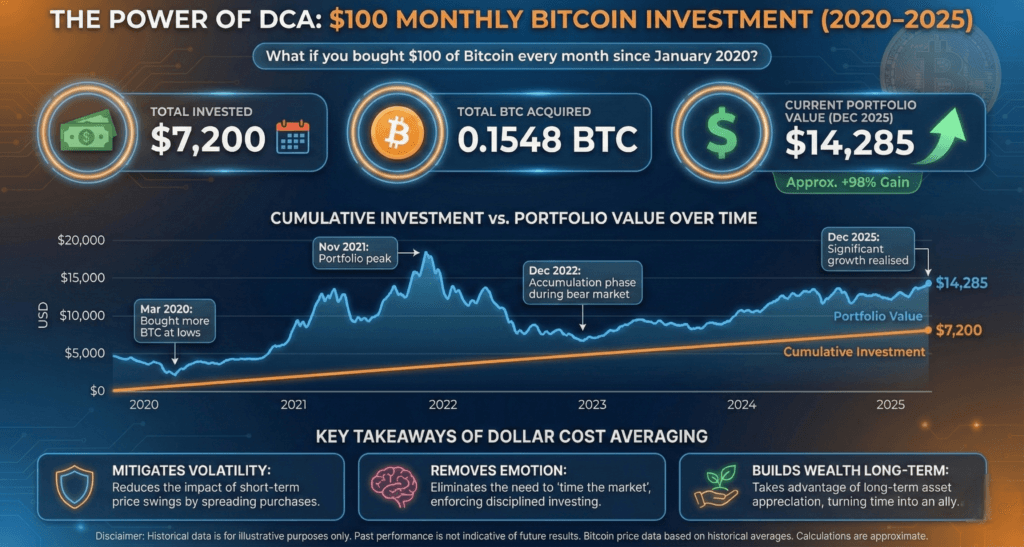
The Bitcoin DCA Simulation: $100/Month (Jan 2020 – Today)
Let’s run the numbers using our specialized BItcoin DCA Calculator.
- Asset: Bitcoin (BTC)
- Strategy: DCA (Monthly)
- Investment: $100 per month
- Start Date: Jan 1, 2020
- End Date: Today
The Results: If you had stuck to this plan, you would have invested a total of roughly $6,000 over 5 years.
But what is that worth today?
According to our calculator, that portfolio would be worth significantly more often 2x to 3x your initial investment depending on today’s exact price.
(Go ahead, check the calculator yourself to see the exact live value right now!)
Why DCA Beats “Timing the market”
If you tried to “Time the Market” in 2020, you might have panicked during the COVID crash in March 2020 when Bitcoin dropped to $3,800. You would have sold.
But with DCA, you would have automatically bought more Bitcoin at $3,800, which would now be up over 2,000%.
Factor in inflation (New feature)
Making money is great, but does it buy as much as it used to? The US Dollar has lost purchasing power since 2020 due to record-high inflation.
Our Inflation-Adjusted Crypto Calculator now features a “Real ROI (Inflation Adjusted)” toggle. This uses real Consumer Price Index (CPI) data from the Federal Reserve to show you if your crypto gains are actually beating inflation.
Check your own portfolio using Bitcoin DCA method
You don’t need to log into an exchange to see these stats. You can simulate any strategy instantly:
- Lump Sum vs. DCA: Compare buying once vs. buying monthly.
- Altcoins: Check coins like Solana (SOL), Ethereum (ETH), or even Shiba Inu.
- Historical Data: Our engine pulls accurate daily prices going back to 2013.
Click here to choose any coin and run your own simulation and see exactly what your portfolio could have been.